
Loud enough, and not too loud
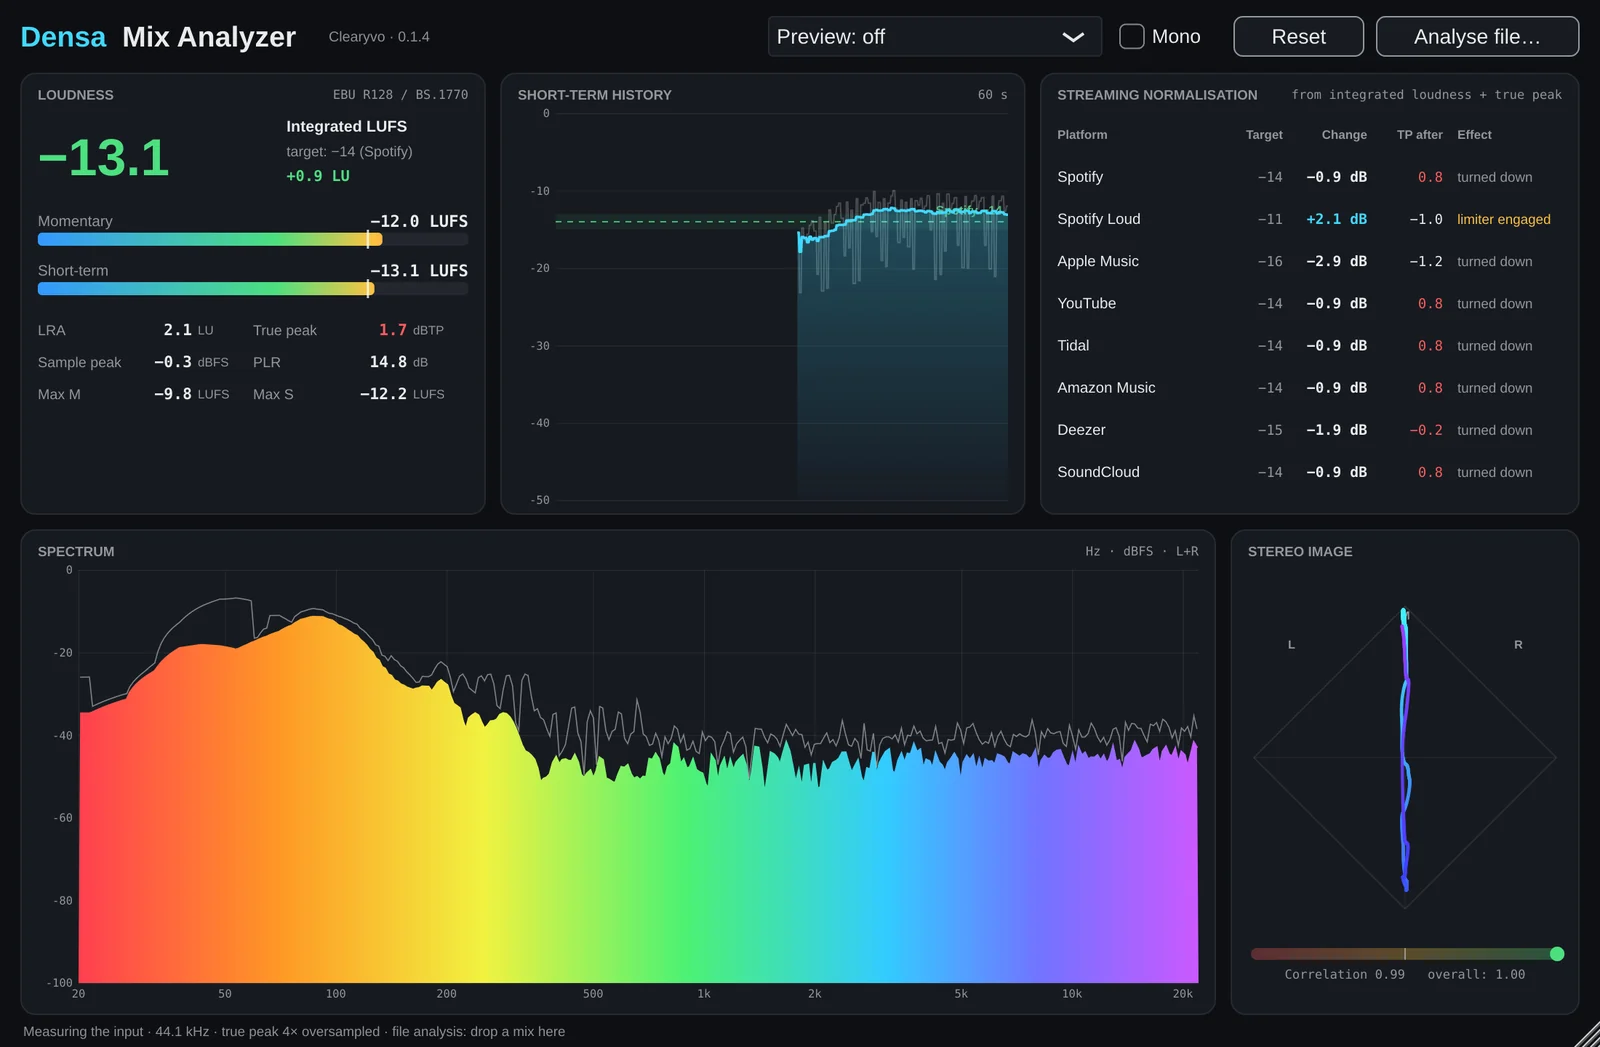
Densa Mix Analyzer measures a mix the way streaming platforms and broadcasters do: integrated, short-term and momentary loudness in LUFS, loudness range, true peak, sample peak and PLR, with a 60-second short-term history drawn against the target of the platform you choose.
What streaming will do to your mix
For Spotify, Spotify Loud, Apple Music, YouTube, Tidal, Amazon Music, Deezer and SoundCloud it shows how much the platform will turn your mix down or up, what the true peak will be afterwards, and whether a peak ceiling or a limiter would step in.
Streaming preview applies that change to what you hear, so you listen to the mix as it will play there. Mono folds the output to (L+R)/2 for a compatibility check. Neither touches the measurement.
Spectrum and stereo image
- Spectrum from 20 Hz to 20 kHz on a log scale, with peak hold and Hz/dB readout under the pointer
- Goniometer (M/S) with momentary and overall correlation, and a warning when the mix has mono problems
Check a whole file
Drop a bounce on the window, or choose one: WAV, AIFF, FLAC, MP3, OGG or M4A. You get the whole-file integrated loudness, loudness range, true peak, PLR and correlation, the platform table, and the short-term curve across the entire track.

In your DAW or on its own
One code base builds the standalone Mac app, an AU plug-in for Logic and GarageBand, and a VST3 plug-in for Ableton Live, Cubase, Reaper and FL Studio. In a DAW, put it last on the master bus, after the limiter.
Measured, then checked
Loudness follows ITU-R BS.1770-4 and loudness range EBU Tech 3342; true peak is measured with 4× oversampling up to 48 kHz. In our tests the integrated reading stays within 0.04 LU of the pyloudnorm reference at 44.1, 48 and 96 kHz.
The meters come from the same measurement engine as Densa Studio and the Densa DSD Player‘s analysis window: the same audio gives the same numbers in all three.

